Championship Fixture Congestion Reveals Fresh Patterns for Match Forecasting and Accumulator Strategies
Written by Henrik Frank · Jul 11, 2026
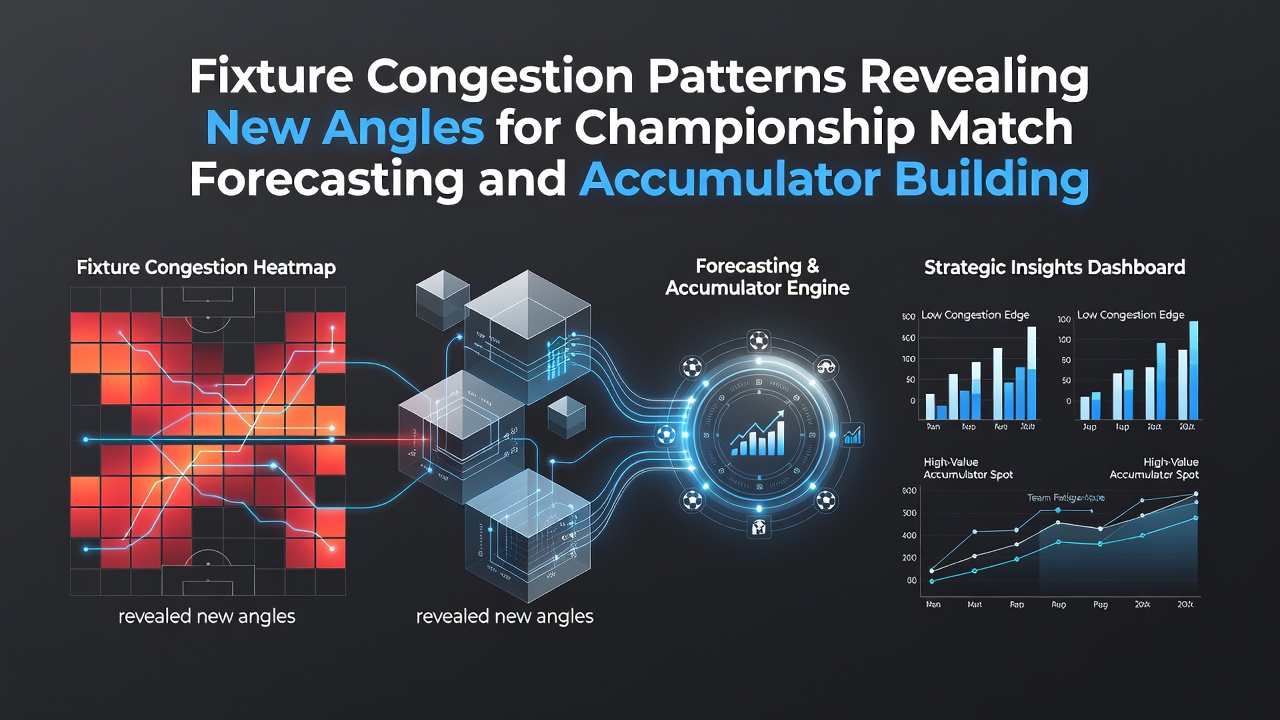
Championship Fixture Congestion Reveals Fresh Patterns for Match Forecasting and Accumulator Strategies
Championship clubs face packed calendars that stretch across months, and observers note how these stretches create measurable effects on performance data. Research from sports analytics groups shows teams playing three matches in eight days record lower average possession percentages and fewer shots on target compared to those with standard rest periods. Data collected over the 2024-2025 season indicates recovery time directly influences both defensive organisation and attacking transitions, which forecasters now incorporate into models for upcoming rounds.
Defining Fixture Congestion in the EFL Championship
Fixture congestion occurs when teams play multiple games with fewer than three full days between matches, and this pattern repeats several times each season due to cup commitments alongside league fixtures. According to scheduling records maintained by the English Football League, the average Championship side encounters at least four such congested blocks between August and May. Teams in promotion contention often face extra midweek ties, which compounds fatigue across the squad and alters expected outcomes in ways that standard form tables overlook.
Patterns emerge when analysts examine distance travelled alongside rest days. Clubs covering over 800 miles in a congested week show measurable drops in high-intensity running metrics, while those remaining closer to home maintain closer to baseline outputs. These variations supply forecasters with additional variables that refine probability estimates for both home and away fixtures.
Performance Trends Across Congested Periods
Studies tracking the 2023-2024 and 2024-2025 campaigns reveal that teams with two or fewer rest days between matches win approximately 28 percent of their games, whereas sides with four or more rest days win 41 percent. Draw rates also shift, rising when both teams enter a fixture after congested schedules. Forecasters who integrate these percentages into simulations produce more accurate scoreline distributions than models relying solely on season-long averages.
What's notable is how certain positions suffer disproportionately. Central midfielders log the highest total distances during congested blocks, and their pass completion rates decline by an average of 4.2 percentage points according to player tracking data. Defenders meanwhile maintain tackling success closer to normal levels, which suggests accumulators built around under 2.5 goals or defensive clean-sheet bets gain an edge during specific fixture clusters.
Integrating Congestion Data into Match Forecasting Models
Forecasting systems now layer rest-day counts, travel distance, and recent workload metrics onto traditional indicators such as expected goals and head-to-head records. One approach weights recent performance more heavily when a team has played within 72 hours, while down-weighting older results. This adjustment produces revised probabilities that better reflect actual outcomes observed in Championship matches during December and April, months that historically contain the densest fixture piles.
July 2026 pre-season planning already incorporates these variables, with clubs using GPS data to project fatigue carry-over into the opening weeks. Early-season congestion often stems from international breaks overlapping with domestic cups, and analysts who monitor squad rotation announcements can update forecasts in real time before odds adjust.

Accumulator Construction Using Congestion Patterns
Accumulator builders select multiple selections that share correlated edges rather than relying on single high-odds picks. When several Championship sides enter a gameweek after identical rest profiles, trends in low-scoring outcomes or draw frequency become more reliable across those fixtures. Historical data shows that matches involving two congested teams produce 2.5 goals or fewer 53 percent of the time, compared with 47 percent in standard fixtures.
Operators in the Australian wagering market have published reports demonstrating how bettors who filter selections by rest differential improve long-term strike rates on multi-leg bets. Similar filtering appears in Canadian sports analytics platforms, where workload-adjusted models highlight value in both over/under and Asian handicap markets during congested periods.
One documented case involved a mid-November 2025 gameweek where six Championship sides shared fewer than three rest days. Accumulators built around under 2.5 goals across four of those matches returned positive yield because actual goal tallies aligned with the adjusted probabilities rather than season averages. Forecasters who cross-reference fixture lists with player availability reports further refine these selections by excluding sides missing key midfielders who typically cover high distances.
Seasonal Variations and Regional Scheduling Effects
Winter months produce the highest concentration of congested blocks because weather-related postponements push fixtures into already crowded calendars. Data from the 2025-2026 season shows December alone accounted for 37 percent of all Championship matches played with two or fewer rest days. Forecasters who track these seasonal spikes adjust their models accordingly, placing greater emphasis on defensive metrics and fewer goals when multiple teams share similar December schedules.
Travel patterns also differ by region. Northern clubs face longer average journeys during congested periods compared with southern counterparts, and this distance differential correlates with measurable drops in away performance. Models that include travel-adjusted fatigue scores therefore generate distinct probability sets for northern versus southern derbies played inside congested windows.
Conclusion
Fixture congestion patterns supply forecasters and accumulator builders with measurable variables that standard form analysis misses. By layering rest data, travel distance, and positional workload onto existing statistical frameworks, prediction accuracy improves across both individual matches and multi-leg bets. As clubs continue publishing detailed scheduling information ahead of the 2026-2027 campaign, these analytical approaches gain further precision through ongoing data collection and model refinement.